
Let me walk you through setting up a new project and implementing rules to modify the response. Then, we will simulate the working of Proxytool under edge case scenarios and observer its effects on the request usage chart.
Note: We have used Proxytool's API to demonstrate our request usage chart.
Features of ProxyTool
Proxytool is a powerful mocking tool essentially designed for developers. It allows the creation of a proxy between your frontend and backend of the web application. Developers can perform application testing using modified or custom requests and responses to implement frontend features without waiting for the backend server.
Proxytool is a combination of the following features:
- Partial Mock - Mock/change only a part of the request/response. For example, add an extra header to the request, like an auth token. Or you can add an icon to every element in the response list.
- Full Mock - Mock an entire response. When your backend is not ready, just mock it like it's working.
- Custom Code - Create requests from the custom code, so you can get data from other APIs.
Read more about them in the description of Mocking 2.0
The request usage chart
Proxytool provides a request usage chart to its registered users on the dashboard. You can gather some important information through this chart, like guessing the load on your application at certain times and days.
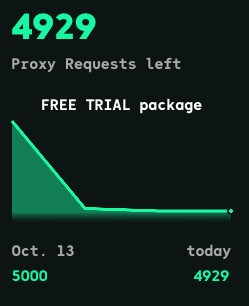
A simple request usage chart is given below. This chart shows pretty generic usage. The hike from the beginning indicates intensive usage in the initial days, and then the flat line shows no usage for some days.
We also have the remaining requests under the free trial or the subscription plan. You can consider the y-axis labeled with the number of requests and the x-axis with the date.
To understand the unusual scenarios and their effect on the Proxytool request graph. The possible edge cases we will cover with this example project are:
- Don’t use Proxytool for 2 weeks, then use the whole quota in 1 day
- Use all requests quota in 2 days, then don't use it for 2 weeks
- Linear usage
- Upwards change (You upgrade your package in a month)
Setup the project
We log in to our Proxytool account and create a new project on the dashboard. We have used the following configuration for the new project setup:
name: Proxytool Mock
url: https://api.proxytool.io
After creating the new project, we are inside the project screen. Here we can implement new rules to mock the request and response bodies or add custom logic.

Before moving forward, we replaced the backend URL in our Proxytool UI's webpack configurations.
plugins: [
   new webpack.EnvironmentPlugin({
     baseUrl: 'https://proxytoo-xst.proxytool.xyz',
   }),
 ],
Our original Proxytool API request URL is:
https://api.proxytool.ioAnd the mocked Proxytool application is accessible on the following URL:
https://proxytoo-xst.proxytool.xyzOriginal response for /balanceHistory
Hitting the original Proxytool URL produces the following output.
// https://api.proxytool.io/balanceHistory

[
 {
   "balanceDate": 20221013,
   "balance": 4931,
   "startBalance": 5000
 },
 {
   "balanceDate": 20221014,
   "balance": 4929,
   "startBalance": 4931
 },
 {
   "balanceDate": 20221017,
   "balance": 4929,
   "startBalance": 4931
 }
]
Mocked response for /balanceHistory
Now, we want to get a fixed response without making any request to the backend. So, we use the URL given by Proxytool for making the requests and setting a fixed response.
https://proxytoo-xst.proxytool.xyz/balanceHistoryScenario 1.

We add it as a Fix Response rule in Proxytool to mock the response without sending a request to the backend.
You can save each dataset to a different rule. Just use the same path but with a readable name. And then, you can turn them on or off with the isActive switch.
Output
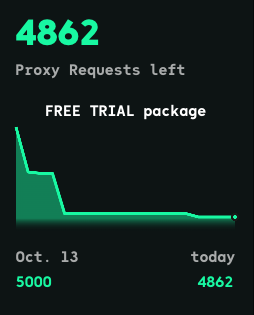
With the simple 3 points dataset, we get the following simple request usage chart.
The above graph is clearly indicating our trend of making requests to the URL. It started from a higher point, and then the line just becomes flat, showing no usage.
Scenario 2.
Now let's see a more exciting example and observe the request usage chart created from its response. We modify the response to get the following use case.
Registered on Oct 13, 2022 and never came back until Oct 22, 2022 when we used our whole package (5000 requests) in one day. You can see that from the last data point, where the startBalance is 5000, but the current balance is 0.
[
  {
    "balanceDate": 20221013,
    "balance": 5000,
    "startBalance": 5000
  },
  {
    "balanceDate": 20221014,
    "balance": 5000,
    "startBalance": 5000
  },
   ...
  {
    "balanceDate": 20221022,
    "balance": 0,
    "startBalance": 5000
  }
 ]
Output

Scenario 3.
So let's check another use case. The user started with a small package (5000 requests), then almost ran out of requests then subscribed to a more extensive (15000 requests) package. This is what the chart looks like.

After testing our application with this use case, we found a bug in the displayed chart. The first point represents 5000, but the other big hump is also the same height, while it should be 3 times bigger. So our tests were successful in finding a bug.
Scenario 3. Bug fixed
After fixing it in the code, we see a perfect chart. The starting point represents a small package (5000 requests) and the bigger (15000 requests) package. So, the bug is fixed, and the chart shows the expected output.

Wrapping up
In this article, we have gone through the features of Proxytool and applied unusual scenarios to see the request usage chart. The request usage chart changed the patterns according to the three scenarios, and the last one helped us to identify and fix a bug in the code.
